Wednesday, September 19, 2018

Putting the Drag & Lift devise to the test


I have cut and prepared airfoil blades with six different degrees of twist from root to tip, ranging from 40 degrees to 23 degrees as shown above. And one airfoil blade with no twist (not shown).


The test. Each blade will be placed in the Drag & Lift devise in the wind tunnel at a wind speed of 4.5 m/s. Each blade with the exception of the one with no twist will be set to a pitch at it's tip of 0, 10, 20 and 30 degrees. A shown in the picture.


Four gauges as shown here, set to the individual pitches of 0, 10, 20 and 30 degrees will be used.


Each blade will be tested at the four different pitches and tested. The net drag and lift forces will be measured and calculated using the Vernier force sensors in the drag & lift devise and recorded. My hope was that the "best" blade would produce data that would be a predictor of how that specific blade design would preform when multiples were made and assembled into a rotor hub and generator.


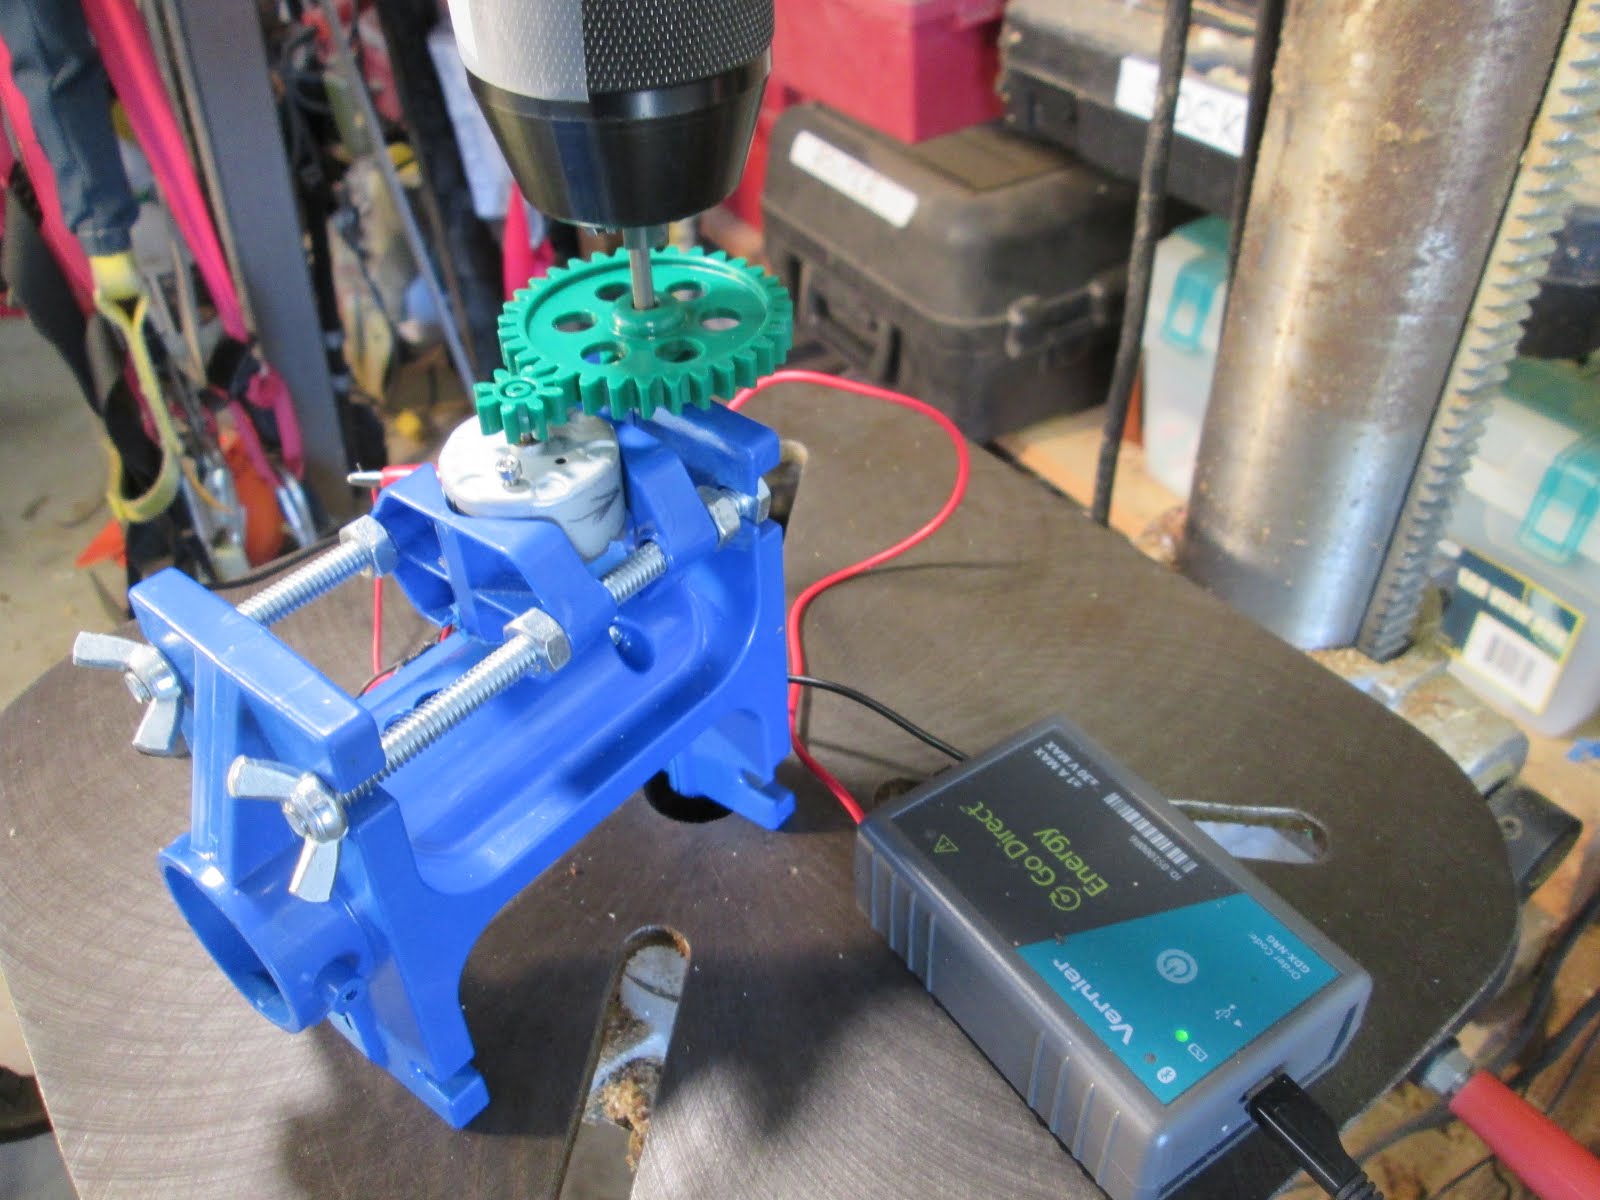
To see if I could find a correlation I tested two previously made sets of airfoil blades. One set with no twist and one set of 6 with a 37 degree twist from root to tip. I would set these blades to 0, 10, 20 and 30 degrees at the tip as shown in the picture. Then record the energy produced in 30 seconds with 30 ohms of load running a KW generator on a 32:1 gear ratio.

Results:
Best energy output in 4.5 m/s wind speed -
6 blade airfoil with no twist for 30 seconds with 30 ohm load and 10 degree pitch at tip
322 rpm at rotor
10,310 rpm at KW generator
9.2 volt average
300 mA average
82.70 Joules produced

Conclusion: Although the airfoil blades with a 37 degree twist did well the airfoil blades with no twist out performed them with the following results in the wind tunnel. I can see no clear indicator in the drag and lift data that would have caused me to select the airfoil blade with no twist to choose as the "best" design and build a 6 blade rotor.

Next -
Using the hot wire and pattern process I will now make 6 airfoil blades with no twist but will thin them out toward the tip attempting to reduce drag at the tip and increase output performance above 82.70 Joules.

Results to follow in next post.


Friday, September 7, 2018

Drag and Lift measuring devise for Kid Wind blades


Lift and Drag are two big factors to consider in the design and performance of blades that make up the rotor for a Kid Wind turbine. To test performance students will design a blade and then make multiples (2, 3, 4, 6, 12) to fit the KW hub. This takes considerable time and materials even if you just make 2 or 3 for a test of output.


Imagine a devise that when a single prototype blade design is mounted and placed in the wind tunnel would measure the Drag and Lift at the same time. Imagine that this devise could be used to determine the specific pitch angle that produces the most Drag and Lift for that blade design.


Well here it is.
In this position, looking straight on with the blue styrofoam blade mounted you can see the Drag on the blade causes the vertical shaft to be rotated and that force is measured by the Vernier force sensor. The sensor is attached to the aluminum rod and this rod is screwed into the stick that goes up at a slight angle and is fastened to the horizontal cross bar held in place by bearings at each end. It is NOT attached to the vertical stick behind it, this feature is important!


Now for the Lift measurement. Looking from the side. Sticking out of the back is a stick attached to the crossbar and bearings mentioned before and the two arms that stick out in the photo holding the Drag measuring part of the devise. A second Vernier force sensor mounted on an aluminum rod measures the Lift force on the blade being tested. Note the counter weight on top at the end of the stick. This counterbalances the weight of the blade and Drag portion of the devise.


A KW protractor is mounted to the blade holder and provides a very positive and consistent  measurement of the pitch angle for blades being set at for testing when collecting performance data.


So I have three different blade designs I want to test Drag and Lift performance on. On the left an airfoil with no twist. In the middle I have taken the same airfoil and placed a 45 degree root to tip twist into the design. On the right I have taken the airfoil with a 45 degree twist and tapered the last 2/3 of the blade. Let the testing and data collection begin!

Note: This model is the 2.0 version of this devise. The first, proof of concept was made from PVC pipe and used protractors and pointers to measure the Drag and Lift forces against springs in degrees.


Crude but effective and led me to ...


Todays design using ball bearings and digital force sensors.

Monday, September 3, 2018

Testing small DC generator output


Who would have thought that moving a copper wire through a magnetic field would produce an electric current? Michael Faraday. Well that discovery led to all sorts of things. One of them being the DC (Direct Current) electric motor that uses electricity to produce mechanical motion. When the process is reversed, using mechanical motion, turning the armature inside of a permanent magnetic field, produces DC electricity. That simple?

In the Kid Wind Challenge program we strive to max this out. Designing to get the turbine blades driven by the wind to turn the armature in a generator (DC motor) as fast as possible and produce the most electrical energy. However the speed that the turbine blades turn at is only one part of the electric power producing puzzle. The design of the generator is one of those pieces. DC generators come in many sizes and designs.

In this testing process I will be taking 6 different DC motors shown in the photo above and testing them at different speeds. Rotating the armatures at speeds from 1,000 to 14,000 RPM by 1,000 rpm steps. The electrical energy each produces in 10 seconds with a 30 ohm load will be recorded and compared.

One of the first problems to solve is how to turn the armatures at these speeds. After trying my variable speed hand drill and using a hand held laser tachometer I decided to go with using my drill press.


I could mount the shaft of the generator in the chuck and spin it up. With the Vernier energy sensor attached to the generator leads, voltage and amperage could be collected and recorded on the Lab Quest 2 shown on the bench. Easy right?


Well even though the drill press could be pulleyed to produce multiple rpm speeds changing the belts each time was a real pain. Also getting rpm's in units of 1,000 "directly" was not possible. Unless... I could place a rheostat in line and "dial in" the speed. Did not take long to realize that the drill press motor did not like this as the starting and running windings fought the process. So what to do?


Enter "new" technology. At least new to me. A trip to Tuescher Electric was the answer to my problem. Don fixed me up with a frequency control drive unit and a 3 phase motor to do the job. Whatever frequency the control unit was set to, was the speed (rpm) that the 3 phase motor would run at. How cool is that.


I had an old Delta bench top drill press that I could modify by swapping out the single phase motor with the 3 phase one.


Oh this was going to be a snap, just turn it on and dial in the frequency and you get the rpm you want to test at, right? Well lets not get ahead of ourselves.


First there was the pulley ratio of the drill press to consider. Then there was the gear ratio between the driving gear in the drill press chuck and the 8 tooth pinion attached to each generator input shaft. Plenty of calculations and ratios to consider to get workable combinations. After all 14,000 rpm is a handful. Also there was the nagging doubt that my calculations were wrong. Could be lost and not know it? So I attached another Vernier sensor to measure the rpm (in radians, another new learning step for me in the S.T.E.M. curriculum) thank goodness for the internet.


So this is the final set up for the Generator RPM Testing Station that can be rolled into any classroom and used by Kid Wind Challenge teams to test out the performance of their generators and different rpm. Then use this data to design turbine blades and gear ratios to achieve that speed and energy output. Just like they do in the real world of wind generator turbine design.


After 8 hours of testing, two rounds of testing, 304 data points (6 motors x 14 speeds x 2 = 168 x 3 data points = 304) were collected and graphed. Now the job of analyzing the results and testing different theories with different blade designs and gear ratios can take place. Stay tuned.

On deck, the devise to measure the drag and lift of an individual blade design in the wind tunnel.
In the hole, the system for cutting and assembling airfoil blades with a twist from styrofoam!
Go Kid Wind Challenge teams.